


Converging Evidence
The model in one sequence
The framework proposes a structured sequence linking genetic/epigenetic regulatory system domain activation, biochemical pathway shifts, temporal system domain disruption, and the clustering of autism traits and comorbid conditions.
Autism traits and comorbid conditions do not occur randomly. They cluster in consistent patterns across individuals.
These patterns emerge from shifts in biochemical pathway activity under stress, altering how physiological systems allocate resources.
The model organizes these shifts into a cascade centered on BH4-dependent pathways, regulatory system domain activation, and its impact on temporal system domains.
If the model is biologically accurate, past, present, and future data/research should converge on the same mechanisms, pathways, and system interactions.
How Evidence Converges Around the Accuracy of a Biological Model
Converging evidence matters because a biologically accurate model does not only explain one finding. It organizes past findings, aligns present evidence, and clarifies how later research should be interpreted.
What converging evidence actually shows
A strong biological model reveals an underlying structure that remains consistent across time.
Earlier findings that once looked separate begin to fit together, current research starts pointing toward the same mechanisms, and later studies can be evaluated for whether they confirm the model predictively or reproduce it after the fact.
That is why converging evidence is useful not only for validation, but also for questions of interpretation, timing, and attribution.
What convergence looks like in a strong model
A strong model creates continuity across past findings, present evidence, and later research.
Earlier findings become interpretable
Findings that once appeared scattered can be re-read as parts of the same biological pattern once the correct framework is in place.
Independent evidence begins to align
Separate studies start converging on the same mechanisms, pathways, or sequence rather than remaining isolated observations.
Later research can be judged precisely
New research can then be evaluated for whether it independently confirms the model’s predictions or reproduces the same structure later in time.
Why older evidence can look obvious later
Once the right framework is identified, the data does not change. The interpretation does.
Retrospective coherence
Once the correct framework is applied, older findings begin to align into a coherent structure that was not previously visible as a whole.
Hindsight bias
After that structure becomes visible, the answer can seem obvious in retrospect even though the clarity comes from the framework itself.
Interpreting Convergent Evidence
If the model is accurate, overlap across studies is expected. Interpretation resolves to either independent derivation or unattributed use, based on timing, access, and structural precision.
Independent derivation
- Temporal precedence: The model predates the study.
- Dissemination time gap: Timeline between each study being released. <6 months supports parallel discovery; 6–12 months is ambiguous; >12 months reduces likelihood.
- Publication time gap: From study start to submission; an unconstrained, typical time window supports independent, concurrent work.
- Exposure likelihood: Limited visibility, reach, or access; minimal likelihood of AI-assisted exposure.
- Structural specificity: Similar conclusions reached through distinct hypotheses or methods rather than direct structural replication.
Unattributed use
- Temporal precedence: The model clearly predates the study.
- Dissemination time gap: Timeline between each study being released. <6 months supports parallel discovery; 6–12 months is ambiguous; >12 months reduces likelihood.
- Publication time gap: From study start to submission; a constrained or rushed timeline after the model becomes public suggests reactive publication.
- Exposure likelihood: High visibility, institutional proximity, or plausible AI-assisted exposure.
- Structural specificity: Reproduction of the same mechanisms, sequence, and relationships, with conclusions tested rather than independently derived.
Biological truth creates convergence across time
When a model is biologically accurate, it does more than fit one dataset. It organizes earlier findings, aligns current evidence, and provides a standard for judging later research.
That is what makes converging evidence useful for evaluating both predictive accuracy and attribution.
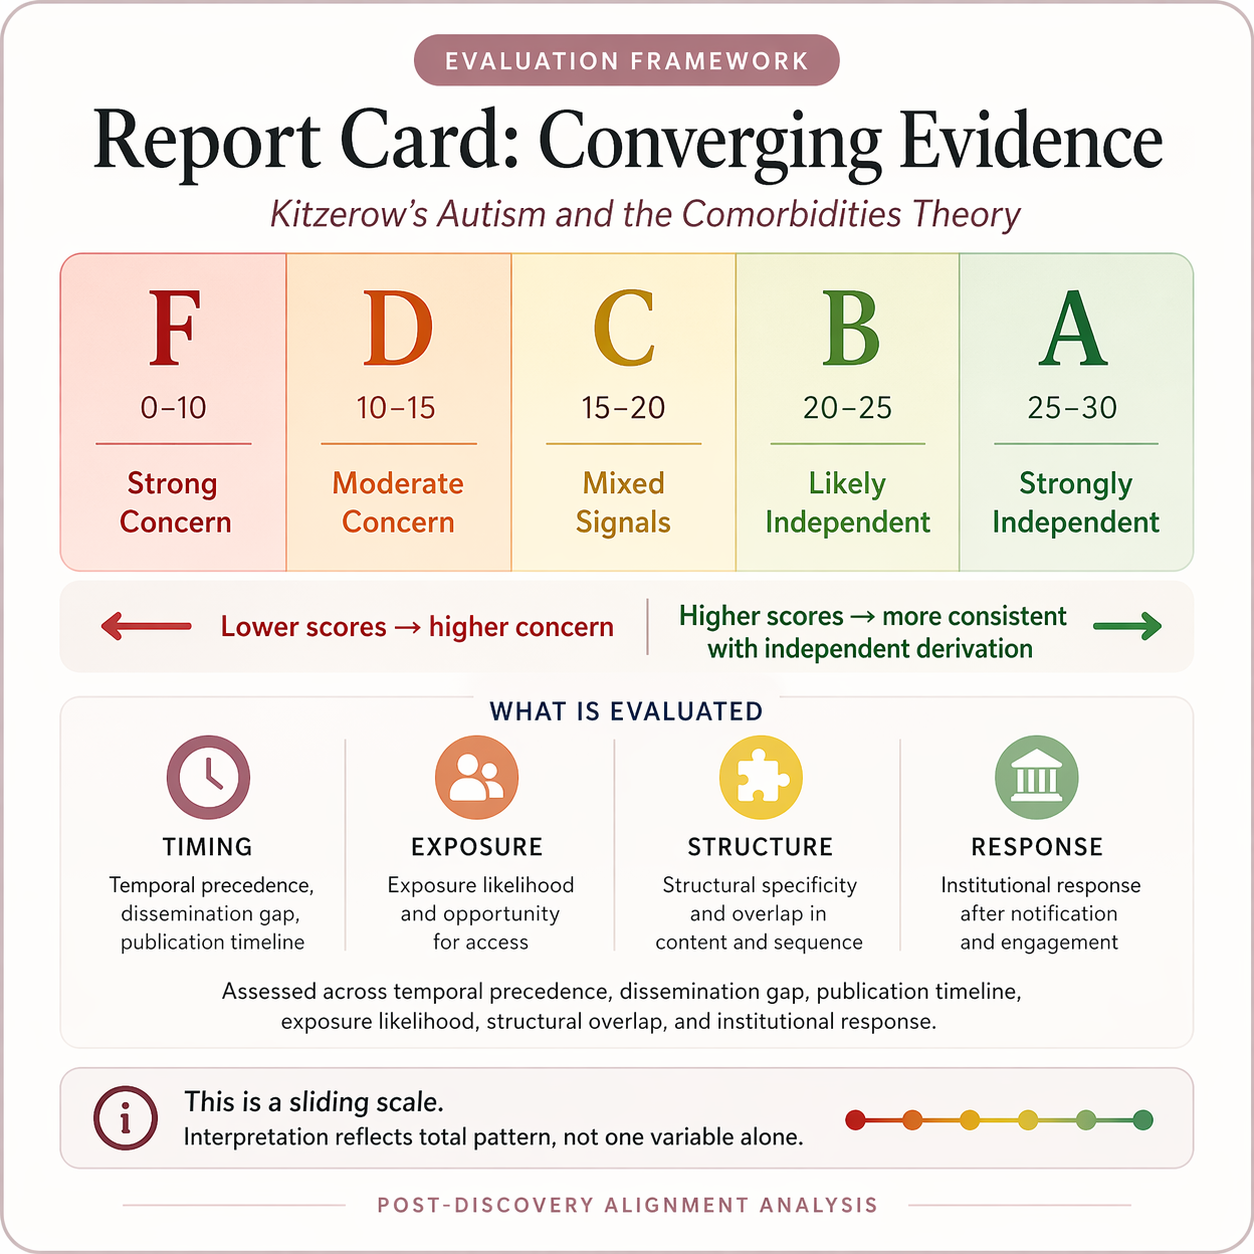
Reference example of the graded score format. This model uses the same visual logic: individual variables are scored on a five-point continuum, then interpreted together as part of a broader sliding scale across converging evidence.
Interpreting Convergent Evidence
This chart is designed to evaluate whether a later study is more consistent with unattributed use or independent derivation. It does not rely on one variable alone. It organizes review across temporal precedence, dissemination gap, publication timeline, exposure likelihood, structural specificity, and institutional response.
In this inverted version, lower-dot positions indicate higher concern and higher-dot positions indicate lower concern. Each variable contributes to the total pattern rather than functioning as a stand-alone verdict. The final score is then read on a graded sliding scale, ranging from patterns more consistent with unattributed use to patterns more consistent with independent derivation.
Temporal Precedence
Framework predates study. This functions as the entry condition for review. If the framework does not predate the study, the rest of the chart should not be used.
Once temporal precedence is established, the remaining variables are interpreted together.
Dissemination Gap
This variable measures how long the framework was publicly available before the later study was published. In this inverted model, a longer dissemination gap supports independent derivation less strongly because it allows more time for circulation, indexing, public dissemination, and AI-mediated exposure. A shorter gap is treated as more concerning.
Publication Timeline
This variable measures the duration of the study itself. In this inverted version, shorter timelines are scored closer to the unattributed-use side because compressed timelines warrant closer scrutiny. Longer timelines are scored closer to the independent-derivation side because they are more consistent with a typical research arc.
Exposure Likelihood
This variable measures how likely it is that the institution or authors could have encountered the framework through direct contact, confirmed affiliation, public dissemination, or AI-assisted access. Lower-dot positions indicate stronger evidence of likely exposure.
Structural Specificity
This variable measures how closely the later study mirrors the original framework. It distinguishes testing the same hypothesis or conclusion without independent derivation, partial structural overlap, and truly independent hypotheses and methods that arrive at converging conclusions.
Institutional Response
This variable documents the institution’s posture after being notified. In this inverted version, collaborative engagement is scored closer to independent derivation, while defensive or dismissive responses are scored closer to unattributed use.
Graded Outcome Scale
Final interpretation is based on total score across variables. This model functions as a sliding scale across converging evidence, ranging from independently derived patterns to patterns more consistent with unattributed use.
Ethically Questionable Institutional Response
PRINCETON CONVERGING EVIDENCE REPORT CARD
This report card evaluates converging evidence within the Princeton study. Grades are assigned A through F, where A reflects independent derivation and F reflects uncredited use. Scoring is based on temporal precedence, dissemination gap, publication timeline, exposure likelihood, structural specificity, and institutional response.
Distinct categories of gene mutations drive specific biochemical pathway changes that produce aligned clusters of autism traits and comorbidities, which they classified into phenotypes.
View Princeton Preprint Admission View Published VersionCategories of gene mutations drive distinct biochemical pathway changes that produce predictable clustering of autism traits and comorbidities.
View Exclusivity Principle in Timeline View BH4 Autism and Comorbidities Paper View 2023 Website View Updated WebsiteAt a Glance
Princeton’s pattern scores low because the dissemination gap is long, the observable publication timeline is short, the structural overlap is highly specific, and the institutional response appears dismissive rather than collaborative.
Kitzerow’s public articulation predates Princeton’s publication by about 26 months.
GitHub first commit to journal receipt is about 62 days.
The overlap is at the level of hypothesis sequence and causal structure rather than topic similarity alone.
Princeton issued a fast determination without substantively engaging the structural evidence.
Articulated Timeline
Each chronology card links directly to the relevant documentation. A source link with an arrow is also placed at the bottom of each card for direct access.
Kimberly Kitzerow articulated the exclusivity principle publicly.
Click to view source Kitzerow — Book Publication September 2023The exclusivity principle was also included in Kimberly Kitzerow’s published book.
Click to view source Princeton — GitHub First Commit May 24, 2024Used here as the earliest visible proxy for when the Princeton study was first started.
Click to view source Princeton — Journal Received Jul 25, 2024This is the endpoint for publication timeline scoring under the framework.
Click to view source Princeton — Published Jul 09, 2025This is the endpoint for dissemination gap scoring.
Click to view sourcePrinceton Converging Evidence Report Card
This report evaluates whether Princeton’s findings reflect independent derivation or uncredited use.
Scored across six criteria: temporal precedence, dissemination gap, publication timeline, exposure likelihood, structural specificity, and institutional response.
Total: 30 points. Lower scores = higher concern. Higher scores = stronger independence.
Score Interpretation
0–10 = F | 10–15 = D | 15–20 = C | 20–25 = B | 25–30 = A
Temporal Precedence
Framework predates study
Value: 3 dots — framework predates study.
Why this score: Kitzerow publicly articulated the exclusivity principle on May 8, 2023, while Princeton’s earliest visible development marker does not appear until May 24, 2024.
Dissemination Gap
Time from framework release to study publication
Value: 1 dot — dissemination gap greater than 12 months.
Why this score: Time from Kitzerow’s framework release on May 8, 2023 to Princeton’s publication on Jul 09, 2025 is approximately 793 days, or about 26 months.
Publication Timeline
Study start to journal submission
Value: 1 dot — publication timeline under 12 months.
Why this score: GitHub first commit on May 24, 2024 to journal received on Jul 25, 2024 is approximately 62 days, or just over 2 months.
Exposure Likelihood
Probability of access to the framework
Value: 3 dots — public exposure possible, no direct documented contact.
Why this score: The framework was public across Kimberly Kitzerow’s websites and published book beginning in 2023, but no direct prepublication contact is documented in this record.
Structural Specificity
Overlap in mechanism, structure, or conclusions
Value: 1 dot — same hypothesis or conclusion tested without independent derivation.
Why this score: Both frameworks follow the same mechanistic chain: categories of gene mutations → distinct biochemical pathway shifts → predictable clustering of autism and comorbid traits.
Institutional Response
Response after notification and publication changes
Value: 1 dot — dismissive response pattern.
Why this score: Princeton issued a rapid electronic dismissal, while the preprint, final publication, and public puzzle-language framing raise unresolved structural concerns without substantive engagement.
Final Interpretation
Princeton’s score pattern concentrates toward the lower end because the dissemination gap is long, the publication timeline is short, the structural overlap is highly specific, and the institutional response appears dismissive rather than collaborative.
With Documented Access
STANFORD CONVERGING EVIDENCE REPORT CARD
This report card evaluates converging evidence within the Stanford study. Grades are assigned A through F, where A reflects independent derivation and F reflects uncredited use. Scoring is based on temporal precedence, dissemination gap, publication timeline, exposure likelihood, structural specificity, and institutional response.
Reticular thalamic hyperexcitability drives autism-like behaviors and can be modulated to reverse those behaviors in a genetic model.
Categories of gene mutations drive distinct biochemical pathway changes that produce predictable clustering of autism traits and comorbidities through downstream circuit-level effects.
At a Glance
Stanford’s pattern scores lower because direct contact is documented, the dissemination window is long, the publication timeline is uncertain, and the tested mechanism converges on the same CSTL-linked causal architecture already articulated in Kitzerow’s earlier work.
Stanford reached out on November 27, 2023 and received the requested information.
Kitzerow’s CSTL formulation and early papers predate Stanford’s 2025 study by well over one year.
The public record begins in March 2025, but the actual internal start date is not visible.
Stanford’s intervention validates a CSTL-linked treatment target that converges closely with Kitzerow’s earlier framework.
Articulated Timeline
No public record of the Stanford model appears prior to the March 2025 preprint. Each event is labeled to distinguish Kitzerow versus Stanford contributions.
Kimberly Kitzerow publicly linked autism mechanisms to CSTL dysfunction.
Click to view source Stanford — Direct Contact Nov 27, 2023Stanford researchers contacted Kimberly Kitzerow and received her information.
Click to view source Kitzerow — Papers Published Jan 2024 to Aug 2024Kimberly Kitzerow published and expanded the CSTL-linked mechanism within her broader causal framework.
Click to view source Stanford — First Public Record Mar 22, 2025First identifiable public articulation of the reticular thalamic hyperexcitability model. No earlier public record is documented.
View preprint Stanford — Published Study Aug 20, 2025Stanford published the reticular thalamic hyperexcitability findings in Science Advances.
View published studyStanford Converging Evidence Report Card
This report evaluates whether Stanford’s findings reflect independent derivation or uncredited use.
Scored across six criteria: temporal precedence, dissemination gap, publication timeline, exposure likelihood, structural specificity, and institutional response.
Total: 30 points. Lower scores = higher concern. Higher scores = stronger independence.
Score Interpretation
0–10 = F | 10–15 = D | 15–20 = C | 20–25 = B | 25–30 = A
Temporal Precedence
Framework predates study
Value: 3 dots — framework predates study.
Why this score: Kitzerow publicly articulated the CSTL link on May 17, 2023, while Stanford’s first public record does not appear until March 22, 2025.
Dissemination Gap
Time from framework release to first public record
Value: 1 dot — dissemination gap greater than 12 months.
Why this score: Time from Kitzerow’s relevant framework release on May 17, 2023 to Stanford’s first public record on March 22, 2025 is approximately 675 days, or about 22 months.
Publication Timeline
Study start to journal submission
Value: 3 dots — insufficient information to determine development timeline.
Why this score: The true study start date is not publicly documented. The earliest available marker is the first preprint on March 22, 2025, which coincides with the journal received date. This could reflect either a short development cycle or lack of visible records. The available data does not allow differentiation.
Exposure Likelihood
Probability of access to the framework
Value: 1 dot — confirmed contact with the institution.
Why this score: Stanford’s Neurodiversity Project reached out on November 27, 2023, prior to the study being published.
Structural Specificity
Overlap in mechanism, structure, or conclusions
Value: 5 dots — independent hypothesis and methods with converging conclusions.
Why this score: E/I imbalance within the CSTL is present, but the mechanism has also been discussed in prior literature. Independent derivation therefore cannot be determined clearly from this overlap alone.
Institutional Response
Response after notification and publication changes
Value: 3 dots — guarded or limited engagement.
Why this score: When sent confirmed prior contact and evidence of structural overlap, Stanford responded through a secured server saying they would look into it, but no follow-through occurred.
Final Interpretation
Stanford’s score pattern concentrates toward the lower middle end of the scale because temporal precedence is established, the dissemination window is long, direct contact is documented, the publication timeline is unknown, and the tested mechanism converges on the same CSTL-linked treatment architecture previously articulated by Kitzerow.
JAPAN CONVERGING EVIDENCE REPORT CARD
This report card evaluates converging evidence within the Japan study. Grades are assigned A through F, where A reflects independent derivation and F reflects uncredited use. Scoring is based on temporal precedence, dissemination gap, publication timeline, exposure likelihood, structural specificity, and institutional response.
Autism-linked mutations converge on a genetically induced stress response, supporting a shared biological stress-state across diverse autism-associated genes.
View Published Study View PreprintAutism traits emerge through genetically induced stress states that shift biological regulation, linking mutation-driven stress adaptation to autism pathology.
View June 13, 2024 VideoAt a Glance
The Japan study reads as independent convergence because its public preprint substantially predates Kitzerow’s June 2024 public articulation, there is no documented direct contact, and the overlap is at the level of broad stress-mechanism convergence rather than a uniquely downstream structural sequence.
The February 2, 2022 preprint predates Kitzerow’s June 13, 2024 public articulation by more than two years.
No institutional contact or confirmed exposure pathway is documented in this record.
The overlap reflects convergence on genetically induced stress biology rather than a uniquely shared downstream sequence.
The timing and record support convergence rather than unattributed use.
Articulated Timeline
Each chronology card links directly to the relevant documentation. Events are labeled to distinguish Japan and Kitzerow contributions.
First public record of the genetically induced stress convergence study.
View preprint Japan — Journal Received Jan 24, 2023The study entered formal journal review.
View source Kitzerow — Public Link Jun 13, 2024Kimberly Kitzerow publicly linked genetically induced stress to autism.
View source Kitzerow — Cellular Homeostasis Paper Jun 11, 2024Kimberly Kitzerow published a paper on genomic and proteomic regulation in cellular homeostasis.
View source Japan — Publish Date Jun 11, 2025Final article record shows publish date in June 2025.
View sourceJapan Converging Evidence Report Card
This report evaluates whether the Japan study reflects independent derivation or uncredited use.
Scored across six criteria: temporal precedence, dissemination gap, publication timeline, exposure likelihood, structural specificity, and institutional response.
Total: 30 points. Lower scores = higher concern. Higher scores = stronger independence.
Score Interpretation
0–10 = F | 10–15 = D | 15–20 = C | 20–25 = B | 25–30 = A
Temporal Precedence
Public dissemination timing triggered review
Value: 3 dots — widespread dissemination occurred later.
Why this score: Although the preprint exists from Feb 2, 2022, the study was not widely disseminated until the formal publication on Jun 11, 2025. This later public release is what triggered review relative to Kitzerow’s work, resulting in a mid-range temporal score.
Dissemination Gap
Time from study release to Kitzerow articulation
Value: 5 dots — prior public study record already existed.
Why this score: The Japan preprint predates Kitzerow’s cited 2024 articulation by more than two years, eliminating concern that the Japan study depended on later public dissemination from Kitzerow.
Publication Timeline
Study start to public dissemination
Value: 4 dots — visible development window exceeds one year.
Why this score: Public preprint appears in Feb 2022, and the final journal record shows receipt in Jan 2023, indicating an observable development/publication runway rather than a compressed late-stage emergence.
Exposure Likelihood
Probability of access to the framework
Value: 5 dots — no documented contact or clear exposure pathway.
Why this score: No direct contact, institutional link, or documented exposure route appears in this record, and the Japan preprint predates Kitzerow’s cited public articulation.
Structural Specificity
Overlap in mechanism, structure, or conclusions
Value: 4 dots — converging mechanism with partial conceptual overlap.
Why this score: The study converges on genetically induced stress as an autism-relevant biological state, but the overlap does not require a uniquely shared downstream sequence and is best interpreted as independent convergence at the stress-mechanism level.
Institutional Response
Response after comparison request
Value: 5 dots — no defensive response pattern documented.
Why this score: This case is being evaluated as independent convergence, and no institutional defensiveness or dismissive response is part of the record presented here.
Final Interpretation
The Japan study aligns best with independent convergence. Its public preprint predates Kitzerow’s cited articulation, no documented exposure pathway is present, and the overlap occurs at the level of broad genetically induced stress biology rather than a uniquely shared downstream causal sequence.
UCSD Converging Evidence Report Card
This report evaluates whether UCSD’s later 3-hit findings reflect independent derivation or uncredited use. Scoring is based on temporal precedence, dissemination gap, publication timeline, exposure likelihood, structural specificity, and institutional response.
Full Cascade Comparison
Side-by-side framing of the later UCSD model against the earlier publicly developed ordered cascade.
Naviaux Tested
The 2025 3-hit model introduces a literature-derived structured sequence moving from genetic, chronic, and situational stress into metabolic disruption, E/I dysregulation, autism with comorbidities, developmental timing, and neuroplasticity relevance.
Kitzerow Tested
Kitzerow’s theoretical cascade was publicly structured as an ordered model linking stress categorization, BH4 pathway shifts, redox and mitochondrial disruption, CSTL E/I imbalance, autism with predictable comorbidities, developmental timing, and neuroplasticity as terminal adaptive mechanism.
At a Glance
High-level pattern summary before the detailed scoring table.
Naviaux’s earlier model remained centered on Cell Danger Response and mitochondria before shifting to a structured multi-node cascade in 2025.
The 3-hit sequence is presented through literature analysis rather than an independently articulated cascade built prospectively.
MedMaps invited Kitzerow as a special guest in 2024, and Naviaux had confirmed affiliation with that institutional orbit.
After contact and meeting with the vice chancellor, UCSD concluded not enough plagiarism occurred to warrant investigation.
Articulated Timeline
Chronology tracking early public development against the later UCSD expansion and institutional response.
Kitzerow — Silence to Speech
Took nonverbal autistic daughter from silence to speech using neuroplasticity, later documented in memoir form.
View memoir ↗Kitzerow — NeuroToggle Framework
Turned that neuroplasticity work into NeuroToggle, later trademarked and publicly developed as a formal framework.
View NeuroToggle ↗Kitzerow — Cascade Model Publicly Developed
Publicly developed the autism and comorbidities cascade with stress categories, biochemical shifts, downstream traits, developmental timing, and neuroplasticity.
View timeline ↗Naviaux — CDR Model Established
Cell Danger Response model formally introduced in 2013 and remains mitochondria-focused for over a decade, with a healing-cycle update in 2023.
View CDR paper ↗Naviaux — 3-Hit Expansion Released
New 3-hit model introduces a structured literature-derived cascade and explicitly states neuroplasticity can improve outcomes.
View study ↗UCSD — Institutional Response
After contact and meeting with the vice chancellor, UCSD concluded that not enough plagiarism occurred to warrant investigation.
Context source ↗Score Interpretation
Lower scores indicate higher concern. Higher scores indicate stronger evidence for independence.
Detailed Scoring Table
Six-factor report card formatted as a formal evaluation sheet.
| Category | Score | Value and Why This Score Was Chosen |
|---|---|---|
Temporal PrecedenceFramework predates study |
|
Value: 3 dots — framework predates study. |
Dissemination GapTime from framework release to study publication |
|
Value: 1 dot — dissemination gap greater than 12 months. |
Publication TimelineStudy start to journal submission |
|
Value: 1 dot — no disclosed independent derivation timeline. |
Exposure LikelihoodProbability of access to the framework |
|
Value: 1 dot — confirmed affiliation pathway. |
Structural SpecificityOverlap in mechanism, structure, or conclusions |
|
Value: 1 dot — same ordered cascade structure replicated. |
Institutional ResponseResponse after notification and publication changes |
|
Value: 1 dot — dismissive response pattern. |
Final Interpretation
Bottom-line readout of the overall score pattern.
Interpretation
UCSD’s score pattern concentrates toward the lower end because the earlier Naviaux model was stable for over a decade, the 2025 3-hit expansion mirrors the ordered cascade through literature synthesis rather than independent derivation, confirmed affiliation existed through MedMaps, and UCSD declined formal investigation after notice.
How This Theoretical Model Was Built
Kitzerow’s Autism and the Comorbidities Theoretical Model was built through the Jigsaw Puzzle Research Methodology, a systems analysis approach that starts with a conserved biochemical reference framework and then compares demographic-level biomarker findings against it to identify recurring dysregulation and reconstruct a coherent cascade.
This methodology does not treat biomarkers, pathways, and studies as isolated findings. It evaluates whether repeated patterns fit one coherent biological structure.
Build the Reference System
Construct a conserved biochemical network of gene-coded proteins as the reference framework.
Compare Population Data
Map demographic-level biomarker datasets onto that framework.
Detect Dysregulation
Identify recurring deviations across datasets, pathways, and regulatory systems.
Reconstruct the Cascade
Trace those repeated patterns into a biochemical sequence linking autism traits and comorbidities.
What Was Known
Stress biology, mitochondrial dysfunction, excitatory and inhibitory imbalance, and developmental timing were already present in the literature. These findings existed as separate pieces rather than one structured system.
What Was Structured
The model organized these components into a directional cascade connecting stress activation, BH4 pathway redistribution, neural circuit disruption, and comorbidity clustering.
What Remains
Individual nodes have now been tested across multiple studies. What remains is mathematical modeling of the full biochemical network and analysis of outcome prediction accuracy.
The Framework Broken Into Four Testable Components
Each part of the cascade can be tested independently. The studies below align with different components of the model and lead directly into the convergent research analysis.
1. Stress Activation
Genetic and epigenetic factors activate internal stress-response systems across regulatory domains. These activations may be situational, chronic, or genetically driven, and their duration shapes downstream effects.
Testable component: Do genetic and epigenetic mutations produce a convergent and sustained stress-response state across regulatory systems?
Aligned studies: Japan
2. BH4 Pathway Shunt
Stress-response activation redirects biochemical pathway activity through the redox-regulated, GCH1-mediated BH4 Shunt, shifting activity across AAAH, NOS, and AGMO pathways.
Testable component: Does stress-induced BH4 pathway redirection produce biochemically linked autism and comorbid trait clustering?
Aligned studies: Brazil and Italy
3. Neural Circuit Disruption
AAAH pathway shifts alter neurotransmitter balance and contribute to excitatory and inhibitory imbalance within cortico-striatal-thalamic circuitry, driving the expression of autism traits.
Testable component: Does disruption of excitatory and inhibitory balance within CSTL circuitry produce autism traits?
Aligned studies: Stanford and Yale
4. Comorbidity Clustering
Epigenetic redox-sensitive protein shunts alter biochemical pathway activity across systems, disrupt biological timing coordination, and produce consistent clustering of autism traits and comorbid conditions over time.
Testable component: Do genetic and epigenetic factors alter biochemical pathway activity, producing consistent clustering of autism and comorbid traits?
Aligned studies: Princeton
Together, these studies do not test the same part of the framework. They test different nodes within the same cascade.
The convergent research section below examines whether those nodes were independently derived or whether the same structured system was reproduced after the framework had already been publicly articulated.
How the research maps to the framework
Each tested framework component is presented as a question, followed by research that directly answers it.
Stress Activation
Do autism-associated gene mutations produce a common and convergent stress-response state across regulatory systems?
2025 Japanese Study
Every autism-associated mutation produced a common and convergent stress-response state.
BH4 Pathway Shunt
Does BH4-dependent pathway redirection under stress biochemically link autism traits and comorbid conditions?
2025 Brazilian Study
BH4 pathway dysfunction links autism and comorbid conditions across biological systems.
Neural Circuit Disruption
Does disruption of excitatory and inhibitory balance within CSTL circuitry produce autism traits?
2025 Stanford + 2026 Yale
All autism-related behaviors were reversed in all mice using Z944, targeting E/I balance in the reticular thalamus, with glutamate receptor alterations later confirmed.
Comorbidity Clustering
Do genetic and epigenetic factors alter biochemical pathway activity in a way that produces consistent clustering of autism and comorbid traits?
2025 Princeton Study
Genetic mutation categories altered distinct biochemical pathway activity leading to consistent phenotypic clusters.
NOS Shunt → Epigenetic Redox Sensitive Protein Shunt - mTOR
Do nitric oxide-mediated redox modifications alter mTOR signaling in a way that disrupts synaptic pruning in autism?
2026 Hebrew University Study (Amal Lab)
Nitric oxide-mediated S-nitrosylation of TSC2 disrupts inhibitory control over mTOR, resulting in mTOR overactivation and altered synaptic pruning in autism.
BH4 Shunt → Redox-Driven Cellular State
Do autism biomarkers show oxidative stress and membrane lipid remodeling consistent with a BH4-dependent redox shift?
2026 Nature Study
A test classified autism with over 93% accuracy by detecting oxidative stress signatures with associated membrane lipid remodeling, indicating a stable redox-driven biological state that simultaneously alters membrane structure.
Full Cascade Replication
This section evaluates alignment at the level of the full cascade rather than individual mechanisms.
Kitzerow's Theoretical Cascade Model
The framework was structured as an ordered sequence integrating stress categorization, biochemical pathway shifts, neural circuit disruption, and downstream outcomes.
- 3-factor stress states (genetic, chronic, situational)
- BH4 Shunt trifurcation (AAAH, NOS, AGMO)
- Redox + mitochondrial + E/I dysregulation
- Autism traits + predictable comorbidities
- Developmental timing
- Neuroplasticity as a terminal adaptive mechanism
Documented in 2023 by Kitzerow.
3-Hit Expansion (Literature Analysis)
Naviaux’s earlier model centered on the Cell Danger Response without a sequenced multi-node cascade.
The 2025 expansion introduces a structured sequence derived through literature analysis:
- 3-hit stress model (genetic, chronic, situational)
- Mitochondrial/metabolic shift
- E/I dysregulation
- Autism + comorbidities
- Developmental timing
- Neuroplasticity relevance
The alignment occurs at the level of ordered structure, not isolated mechanisms. The sequence of stress categorization, pathway redirection, circuit disruption, phenotype clustering, developmental timing, and neuroplasticity appears in the same directional progression.
This reflects replication of a structured cascade integrating multiple biological systems rather than overlap in individual components.
Post-2023 Convergent Research Analysis
These studies were released after Kimberly Kitzerow publicly documented her framework. The question is not whether individual concepts such as stress biology, mitochondrial dysfunction, excitatory and inhibitory imbalance, or developmental timing already existed in the literature. The question is whether later work reorganized those elements into the same ordered scaffold after that scaffold had already been publicly articulated.
High Structural Alignment
UC San Diego / Naviaux / “3-Hit” Autism Model Expansion / 2025
Click here to read the study and documented timeline
What the Study Shows
- Presents autism through a formal three-hit structure rather than a single stress-state model.
- Uses genetic vulnerability, chronic background load, and situational triggering as distinct categories.
- Frames autism and systemic disease within a sequenced stress-mediated cascade.
- Includes mitochondrial and metabolic disruption, excitatory and inhibitory dysregulation, developmental timing, and neuroplasticity relevance.
- Functions as a literature-based synthesis rather than a new primary experimental dataset.
Overlap with the Model
- Matches Kimberly’s public three-factor stress-state structure: genetic, chronic, and situational.
- Matches an ordered downstream progression rather than isolated mechanisms.
- Includes excitatory and inhibitory dysregulation as a downstream node rather than a starting point.
- Includes autism with comorbidities, followed by developmental timing, followed by neuroplasticity relevance.
- The inclusion of neuroplasticity as an outcome-modifying terminal mechanism parallels the endpoint position assigned to NeuroToggle within Kimberly’s framework.
Criteria Analysis
Kimberly’s framework was publicly documented in 2023 and further elaborated across 2024 and 2025 before the 2025 publication of the UCSD expansion.
The public gap between Kimberly’s release and the UCSD publication is greater than 12 months. Under the defined criteria, that reduces the likelihood of parallel discovery.
Structural specificity is high. The overlap includes the same categorical stress taxonomy, the same directional scaffold, a sequenced excitatory and inhibitory node, autism plus comorbidity simultaneity, developmental timing placed downstream, and neuroplasticity as a terminal adaptive mechanism influencing outcomes. Because this publication is a synthesis rather than a primary experimental study, the main point of comparison is its architectural organization of preexisting literature, and that organization aligns closely.
The relevant dissemination interval is approximately 18 to 24 months. Under the defined criteria, that exceeds the range that would support parallel discovery.
Exposure likelihood is high. Kimberly’s framework was public, searchable, and actively disseminated. In addition, Naviaux has direct ties to the MedMaps group, which invited Kimberly as a special guest in 2024. This does not prove use, but it strengthens the plausibility of network-level exposure beyond general public visibility alone.
Formal outreach status: TBD. A network-level connection is documented through the MedMaps invitation, but no formal institutional response to overlap notification is documented here at this time.
Conclusion
Across variables, the UCSD model demonstrates temporal precedence of Kimberly’s framework, public and dissemination gaps that exceed the threshold supporting parallel discovery, high structural specificity with matched taxonomy, sequence, and endpoint placement, elevated exposure likelihood including network-level proximity, and an institutional response that did not progress to formal investigation. The convergence is architectural rather than conceptual.
High Directional Alignment with Documented Access
Stanford / Reticular Thalamus Intervention in CSTL Circuitry / 2025
Click here to read the study and documented timeline
What the Study Shows
- Moves straight to intervention rather than stopping at description.
- Targets excitatory and inhibitory imbalance in cortico-striato-thalamo-cortical circuitry through the reticular thalamus.
- Treats a defined downstream E/I circuit node as a mechanism of autism-related behavior.
- Reports reversal of autism-related behaviors in mice after intervention at that node.
Overlap with the Model
- Kimberly’s framework places excitatory and inhibitory dysregulation downstream of stress-mediated biochemical shifts.
- Her framework positions the CSTL loop as the functional expression site of this imbalance.
- Stanford later targeted that downstream circuit node directly.
- The alignment is directional: upstream regulatory stress → downstream E/I dysregulation → autism-related behavior.
Criteria Analysis
Kimberly’s public placement of CSTL excitatory and inhibitory dysregulation as a downstream mechanism predates Stanford’s intervention study.
The public time gap is greater than 12 months, which reduces the likelihood of parallel discovery under the defined criteria.
Structural specificity is high at the circuit level. The study targets a defined downstream node, excitatory and inhibitory imbalance within CSTL circuitry through the reticular thalamus, consistent with the positional role assigned in Kimberly’s cascade. This is more specific than shared interest in E/I imbalance alone.
The interval exceeds 12 months and falls outside the range that would support parallel independent derivation under the stated criteria.
Exposure likelihood is high. Stanford’s Neurodiversity Project contacted Kimberly in 2023 requesting her information and her Change petition. That establishes documented access before publication.
Kimberly later raised concerns with Stanford’s research integrity department. She received an immediate response through a secured server, followed by no further engagement. The documented pattern here is direct access followed by non-resolution after notification.
Conclusion
The Stanford study shows temporal precedence, time gaps beyond the range supporting parallel discovery, high structural specificity at the CSTL circuit level, documented direct access before publication, and a post-notification institutional response without substantive follow-up. The alignment is directional from upstream stress architecture to downstream intervention targeting.
Mechanistic Reinforcement of the E/I Pathway
Yale / Glutamate Receptor Mechanism Confirmation / 2025
Click here to read the study and documented timeline
What the Study Shows
- Confirms glutamate receptor involvement in autism-relevant neurological pathways.
- Links excitatory signaling dysregulation to autism-related outcomes.
- Provides receptor-level reinforcement of the E/I balance mechanism.
Overlap with the Model
- Kimberly’s framework identifies glutamate-mediated excitatory imbalance as part of downstream E/I dysregulation.
- That imbalance is placed downstream of BH4-dependent pathway shifts rather than treated as an isolated primary event.
- Yale reinforces the same mechanistic node at receptor-level resolution.
- The overlap is strongest at the mechanism level rather than full cascade architecture.
Criteria Analysis
Kimberly’s framework linking glutamate-driven excitatory imbalance to autism-related pathology was public before this study.
The public time gap is greater than 12 months, reducing the likelihood of parallel discovery under the defined criteria.
Structural specificity is moderate. The overlap is not a full scaffold match. It is the reinforcement of a defined mechanistic node already positioned within Kimberly’s pathway logic: glutamate-linked excitatory dysregulation within the broader E/I balance pathway.
The interval exceeds 12 months and therefore falls outside the range that would support parallel discovery under the defined criteria.
Exposure likelihood is moderate. The mechanism was publicly documented, and Yale acknowledged the theory mechanism alignment without citing Kimberly as the author of the originating framework.
Documented institutional response is limited. The mechanism was reportedly acknowledged in discussion, but no formal attribution to Kimberly as the originating framework author was provided.
Conclusion
Yale provides temporal precedence, sufficient public and dissemination gaps, moderate structural specificity limited to the glutamate-linked E/I node, moderate exposure likelihood through public availability, and only limited institutional acknowledgment without attribution. The convergence is node-level rather than full-cascade replication.
High Mechanistic Alignment in Trait Clustering Logic
Princeton / Gene-Defined Classes, Biochemical Pathway Shifts, and Trait Clustering / 2025
Click here to read the study and documented timeline
What the Study Shows
- Clusters autism and comorbid traits according to distinct biochemical pathway shifts driven by categories of gene mutations.
- The preprint explicitly framed the work as testing whether class-specific gene subsets represent distinct pathways and biological processes.
- This is more than descriptive clustering. It is a mechanistic hypothesis test linking mutation classes to differentiated pathway activity.
- The later journal version shifted emphasis away from explicit pathway-hypothesis language and toward a more statistical exclusivity framing.
Overlap with the Model
- Kimberly’s exclusivity principle states that autism and comorbidities occur simultaneously because categories of gene mutations alter biochemical pathway activity in distinct ways, producing predictable phenotypic clustering.
- Both formulations follow the same causal chain: categories of gene mutations → distinct biochemical pathway shifts → predictable autism and comorbid trait clusters.
- The overlap is mechanistic and structural, not superficial.
- The concern is not the existence of clustering itself. It is the shared pathway-differentiation logic driving the clustering.
Criteria Analysis
Kimberly’s exclusivity principle and pathway-based clustering framework were publicly articulated before Princeton’s 2025 preprint and publication cycle.
The public time gap is greater than 12 months. Under the defined criteria, that reduces the likelihood of parallel discovery.
Structural specificity is high. The strongest alignment is the mechanistic premise itself: categories of gene mutations drive distinct biochemical pathway shifts, which in turn produce predictable clustering of autism and comorbid traits. That is more specific than generic clustering language and more specific than descriptive subtype analysis alone.
The interval between Kimberly’s public articulation and Princeton’s later testing of the same pathway-differentiation premise exceeds 12 months and therefore falls outside the range supporting parallel discovery.
Exposure likelihood is moderate. Kimberly’s work was public and discoverable. No direct prepublication contact is documented here in the same way it is for Stanford, but the overlap concerns were later brought directly to the institution.
Kimberly submitted concerns to Princeton’s research integrity department and received an electronic letter the day after Christmas stating no wrongdoing. The letter was set to expire within 7 days whether opened or not. The structural evidence was not substantively engaged. In addition, the removal of the explicit pathway hypothesis from preprint to journal publication and later public researcher language describing the work as being like “solving a jigsaw puzzle” heighten the attribution concern for Kimberly because Jigsaw Puzzle Methodology is the name of her methodology.
Conclusion
Princeton reflects temporal precedence, public and dissemination gaps beyond the range supporting parallel discovery, high structural specificity in the chain from mutation category to pathway shift to phenotypic clustering, moderate exposure likelihood, and an institutional response that did not substantively engage the structural evidence. The alignment is mechanistic and architectural rather than merely descriptive.
High Output-Level Alignment
Italy / Oxidative Stress and Lipid Remodeling Autism Test / 2025
Click here to read the study and documented timeline
What the Study Shows
- Reports an autism classification test with over 93 percent accuracy.
- Uses oxidative stress signatures and lipid membrane remodeling as the measurable signal.
- Operationalizes a systemic biomarker state rather than a brain-only readout.
Overlap with the Model
- Kimberly had already linked oxidative stress and lipid remodeling as paired downstream outputs of BH4-dependent pathway disruption.
- Within her framework, NOS-related redox dysregulation maps onto oxidative stress and AGMO-related disruption maps onto lipid remodeling.
- The Italian study later measured that same paired downstream state diagnostically.
- The strongest alignment is at the paired-output level.
Criteria Analysis
Kimberly publicly framed the linked significance of oxidative stress and lipid remodeling in autism before the 2025 Italian study release.
The public time gap is greater than 12 months and therefore reduces the likelihood of parallel discovery under the defined criteria.
Structural specificity is high at the downstream output level. Oxidative stress alone is common, and lipid remodeling alone is also not unique. The more specific overlap is the paired use of both outputs as a meaningful autism-linked biomarker state, matching the same downstream pairing already interpreted within Kimberly’s framework.
The interval between Kimberly’s public interpretation and the later Italian diagnostic publication exceeds 12 months and falls outside the range supporting parallel discovery.
Exposure Likelihood is moderate. The framework was public and discoverable, though no direct contact is documented here.
Formal outreach status: TBD. No institutional response is documented here at this time.
Conclusion
The Italian study demonstrates temporal precedence, public and dissemination gaps that exceed the threshold supporting parallel discovery, high structural specificity at the paired-output level, moderate exposure likelihood, and no documented institutional response to date. The strongest convergence is the downstream biomarker pairing of oxidative stress and lipid remodeling consistent with BH4 pathway outputs.
This theoretical model has been independently validated at the mechanistic level.
What mechanistic “validation” means here
The framework’s mechanisms and predicted sequence align with independent experimental findings.
This does not mean the full integrated system has been tested in one study. It means the components are supported by converging evidence.
What validation means in this context
- The mechanisms align with existing biological evidence.
- The pathway relationships match established interactions.
- The predicted sequence aligns with later independent findings.
- No findings directly contradict the proposed cascade.
What has been validated
- Individual nodes are grounded in experimentally supported mechanisms.
- Relationships between nodes reflect established biological interactions.
- Each core pillar has independent research alignment.
- Recent studies converge on the same mechanistic sequence.
What has not been validated
- The full model has not been tested as one integrated experimental system.
- It is not a deterministic predictor of every individual outcome.
- It has not been exhaustively tested across all ages, populations, or biological contexts.
What work remains
- Integrated testing of the full cascade across systems.
- Broader replication across populations and developmental stages.
- Structured modeling of how the components interact together.
- Study designs that test the framework as a coordinated biological system.
Studies Referenced in This Framework
The following studies correspond to the mechanisms mapped in the framework and are provided for direct review and comparison.
Studies are listed in relation to the framework components they correspond to.
- ESC models of autism with copy-number variations reveal cell-type-specific translational vulnerability View Study Here
- Tetrahydrobiopterin and Autism Spectrum Disorder: A Systematic Review of a Promising Therapeutic Pathway View Study Here
- Reticular thalamic hyperexcitability drives autism spectrum disorder behaviors in the Cntnap2 model of autism View Study Here
- Imaging Metabotropic Glutamate Receptor 5 and Excitatory Inhibitory Imbalance in Autism View Study Here
- Nitric Oxide-Mediated S-Nitrosylation of TSC2 Drives mTOR Dysregulation across Autism Models View Study Here
- AI-based autism identification from hyperspectral imaging detection of oxidative stress in pediatric red blood cells View Study Here
- Decomposition of phenotypic heterogeneity in autism reveals underlying genetic programs View Study Here
- A 3-hit metabolic signaling model for the core symptoms of autism spectrum disorder View Study Here